Saturday 12 November 2011

Ratio and Refrences

Profitability ratios

Profitability ratios measure the company's use of its assets and control of its expenses to generate an acceptable rate of return
Gross margin, Gross profit margin or Gross Profit Rate[7][8]
\frac{\mbox{Gross Profit}}{\mbox{Net Sales}}
OR
\frac{\mbox{Net Sales -- COGS}}{\mbox{Net Sales}}
Operating margin, Operating Income Margin, Operating profit margin or Return on sales (ROS)[8][9]
\frac{\mbox{Operating Income}}{\mbox{Net Sales}}
Note: Operating income is the difference between operating revenues and operating expenses, but it is also sometimes used as a synonym for EBIT and operating profit.[10] This is true if the firm has no non-operating income. (Earnings before interest and taxes / Sales[11][12])
Profit margin, net margin or net profit margin[13]
\frac{\mbox{Net Profit}}{\mbox{Net Sales}}
Return on equity (ROE)[13]
\frac{\mbox{Net Income}}{\mbox{Average Shareholders Equity}}
Return on investment (ROI ratio or Du Pont Ratio)[6]
\frac{\mbox{Net Income}}{\mbox{Average Total Assets}}
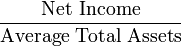
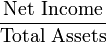
Return on assets (ROA)[14]
\frac{\mbox{Net Income}}{\mbox{Total Assets}}
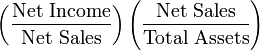
Return on assets Du Pont (ROA Du Pont)[15]
\left(\frac{\mbox{Net Income}}{\mbox{Net Sales}}\right)\left(\frac{\mbox{Net Sales}}{\mbox{Total Assets}}\right)
Return on Equity Du Pont (ROE Du Pont)
\left(\frac{\mbox{Net Income}}{\mbox{Net Sales}}\right)\left(\frac{\mbox{Net Sales}}{\mbox{Average Assets}}\right)\left(\frac{\mbox{Average Assets}}{\mbox{Average Equity}}\right)
Return on net assets (RONA)
\frac{\mbox{Net Income}}{\mbox{Fixed Assets + Working Capital}}
Return on capital (ROC)
\frac{\mbox{EBIT(1 − Tax Rate)}}{\mbox{Invested Capital}}
Risk adjusted return on capital (RAROC)
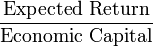
\frac{\mbox{Expected Return}}{\mbox{Economic Capital}}
OR
\frac{\mbox{Expected Return}}{\mbox{Value at Risk}}
Return on capital employed (ROCE)
\frac{\mbox{EBIT}}{\mbox{Capital Employed}}
Note: this is somewhat similar to (ROI), which calculates Net Income per Owner's Equity
Cash flow return on investment (CFROI)
\frac{\mbox{Cash Flow}}{\mbox{Market Recapitalisation}}
Efficiency ratio
\frac{\mbox{Non-Interest expense}}{\mbox{Revenue}}
Net gearing
\frac{\mbox{Net debt}}{\mbox{Equity}}
Basic Earnings Power Ratio[16]
\frac{\mbox{EBIT}}{\mbox{Total Assets}}

[edit] Liquidity ratios

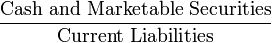
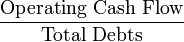
Liquidity ratios measure the availability of cash to pay debt.
Current ratio (Working Capital Ratio)[17]
\frac{\mbox{Current Assets}}{\mbox{Current Liabilities}}
Acid-test ratio (Quick ratio)[17]
\frac{\mbox{Current Assets -- (Inventories + Prepayments)}}{\mbox{Current Liabilities}}
Cash ratio[17]
\frac{\mbox{Cash and Marketable Securities}}{\mbox{Current Liabilities}}
Operation cash flow ratio
\frac{\mbox{Operating Cash Flow}}{\mbox{Total Debts}}

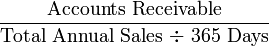
[edit] Activity ratios (Efficiency Ratios)

Activity ratios measure the effectiveness of the firms use of resources.
Average collection period[3]
\frac{\mbox{Accounts Receivable}}{\mbox{Annual Credit Sales ÷ 365 Days}}
Degree of Operating Leverage (DOL)
\frac{\mbox{Percent Change in Net Operating Income}}{\mbox{Percent Change in Sales}}
DSO Ratio.[18]
\frac{\mbox{Accounts Receivable}}{\mbox{Total Annual Sales ÷ 365 Days}}
Average payment period[3]
\frac{\mbox{Accounts Payable}}{\mbox{Annual Credit Purchases ÷ 365 Days}}
Asset turnover[19]
\frac{\mbox{Net Sales}}{\mbox{Total Assets}}
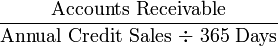
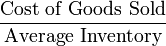
Stock turnover ratio[20][21]
\frac{\mbox{Cost of Goods Sold}}{\mbox{Average Inventory}}
Receivables Turnover Ratio[22]
\frac{\mbox{Net Credit Sales}}{\mbox{Average Net Receivables}}
Inventory conversion ratio[4]
\frac{\mbox{365 Days}}{\mbox{Inventory Turnover}}
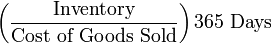
Inventory conversion period (essentially same thing as above)
\left (\frac{\mbox{Inventory}}{\mbox{Cost of Goods Sold}}\right)\mbox{365 Days}
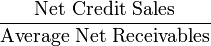
Receivables conversion period
\left (\frac{\mbox{Receivables}}{\mbox{Net Sales}}\right)\mbox{365 Days}
Payables conversion period
\left (\frac{\mbox{Accounts Payables}}{\mbox{Purchases}}\right)\mbox{365 Days}
Cash Conversion Cycle
Inventory Conversion Period + Receivables Conversion Period - Payables Conversion Period

[edit] Debt ratios (leveraging ratios)

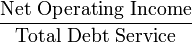
Debt ratios measure the firm's ability to repay long-term debt. Debt ratios measure financial leverage.
Debt ratio[23]
\frac{\mbox{Total Liabilities}}{\mbox{Total Assets}}
Debt to equity ratio[24]
\frac{\mbox{Long-term Debt + Value of Leases}}{\mbox{Average Shareholders Equity}}
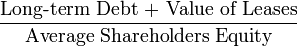
Long-term Debt to equity (LT Debt to Equity)[24]
\frac{\mbox{Long-term Debt}}{\mbox{Total Assets}}
Times interest-earned ratio / Interest Coverage Ratio[24]
\frac{\mbox{EBIT}}{\mbox{Annual Interest Expense}}
OR
\frac{\mbox{Net Income}}{\mbox{Annual Interest Expense}}
Debt service coverage ratio
\frac{\mbox{Net Operating Income}}{\mbox{Total Debt Service}}

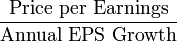
[edit] Market ratios

Market ratios measure investor response to owning a company's stock and also the cost of issuing stock. These are concerned with the return on investment for shareholders, and with the relationship between return and the value of an investment in company’s shares.
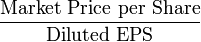
Earnings per share (EPS)[25]
\frac{\mbox{Net Earnings}}{\mbox{Number of Shares}}
Payout ratio[25][26]
\frac{\mbox{Dividends}}{\mbox{Earnings}}
OR
\frac{\mbox{Dividends}}{\mbox{EPS}}
Dividend cover (the inverse of Payout Ratio)
\frac{\mbox{Earnings per Share}}{\mbox{Dividend per Share}}
P/E ratio
\frac{\mbox{Market Price per Share}}{\mbox{Diluted EPS}}
Dividend yield
\frac{\mbox{Dividend}}{\mbox{Current Market Price}}
Cash flow ratio or Price/cash flow ratio[27]
\frac{\mbox{Market Price per Share}}{\mbox{Present Value of Cash Flow per Share}}
Price to book value ratio (P/B or PBV)[27]
\frac{\mbox{Market Price per Share}}{\mbox{Balance Sheet Price per Share}}
Price/sales ratio
\frac{\mbox{Market Price per Share}}{\mbox{Gross Sales}}
PEG ratio
\frac{\mbox{Price per Earnings}}{\mbox{Annual EPS Growth}}
Other Market Ratios
EV/EBITDA
\frac{\mbox{Enterprise Value}}{\mbox{EBITDA}}
EV/Sales
\frac{\mbox{Enterprise Value}}{\mbox{Net Sales}}
Cost/Income ratio
Sector-specific ratios
EV/capacity
EV/output

[edit] Capital Budgeting Ratios

In addition to assisting management and owners in diagnosing the financial health of their company, ratios can also help managers make decisions about investments or projects that the company is considering to take, such as acquisitions, or expansion.
Many formal methods are used in capital budgeting, including the techniques such as

1 comment:

  1. Good job!!! :-)
    Keep it up.

    You are interested in accounting and I am in Biology and Social works....

    ReplyDelete